From the monthly chart down to the H4 liquidity map, one timeframe at a time. Each chart is explained in plain words, then summarised as what we are watching next.
By XAU Setups Desk
2 November 2026
OANDA XAU/USD data
6 min read
Educational only, not financial advice.This is a study of market structure for learning. It is not a signal or a recommendation to buy or sell. Prices move fast; levels can be invalid by the time you read this.
Step 1 · Monthly
What is the big trend?
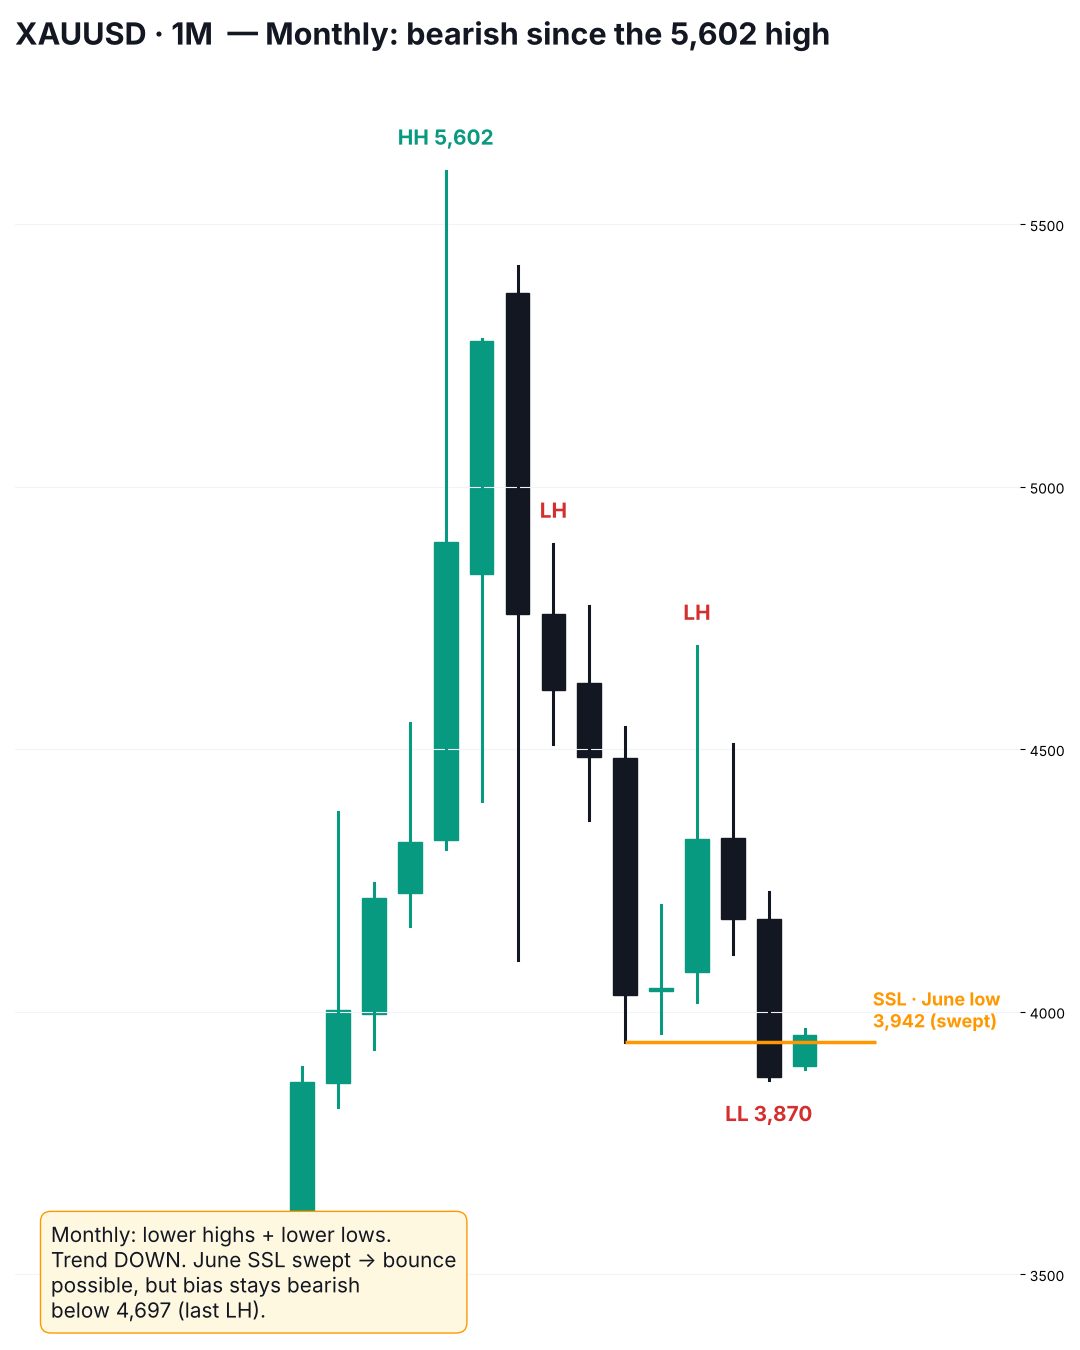
In January 2026 gold printed its highest high at 5,602.
Since then each high is lower than the last: 4,892 in April and 4,697 in August.
The lows are falling too: 4,099, then 3,942 in June, then 3,870 in October.
In October price traded below the June low of 3,942 and took the sell-side liquidity (stops) resting there.
What it means: The big trend is down. Because the June liquidity has been taken, a bounce higher is possible before the next leg, so the monthly chart alone does not give a level to act on.
Step 2 · Weekly
This week's bias
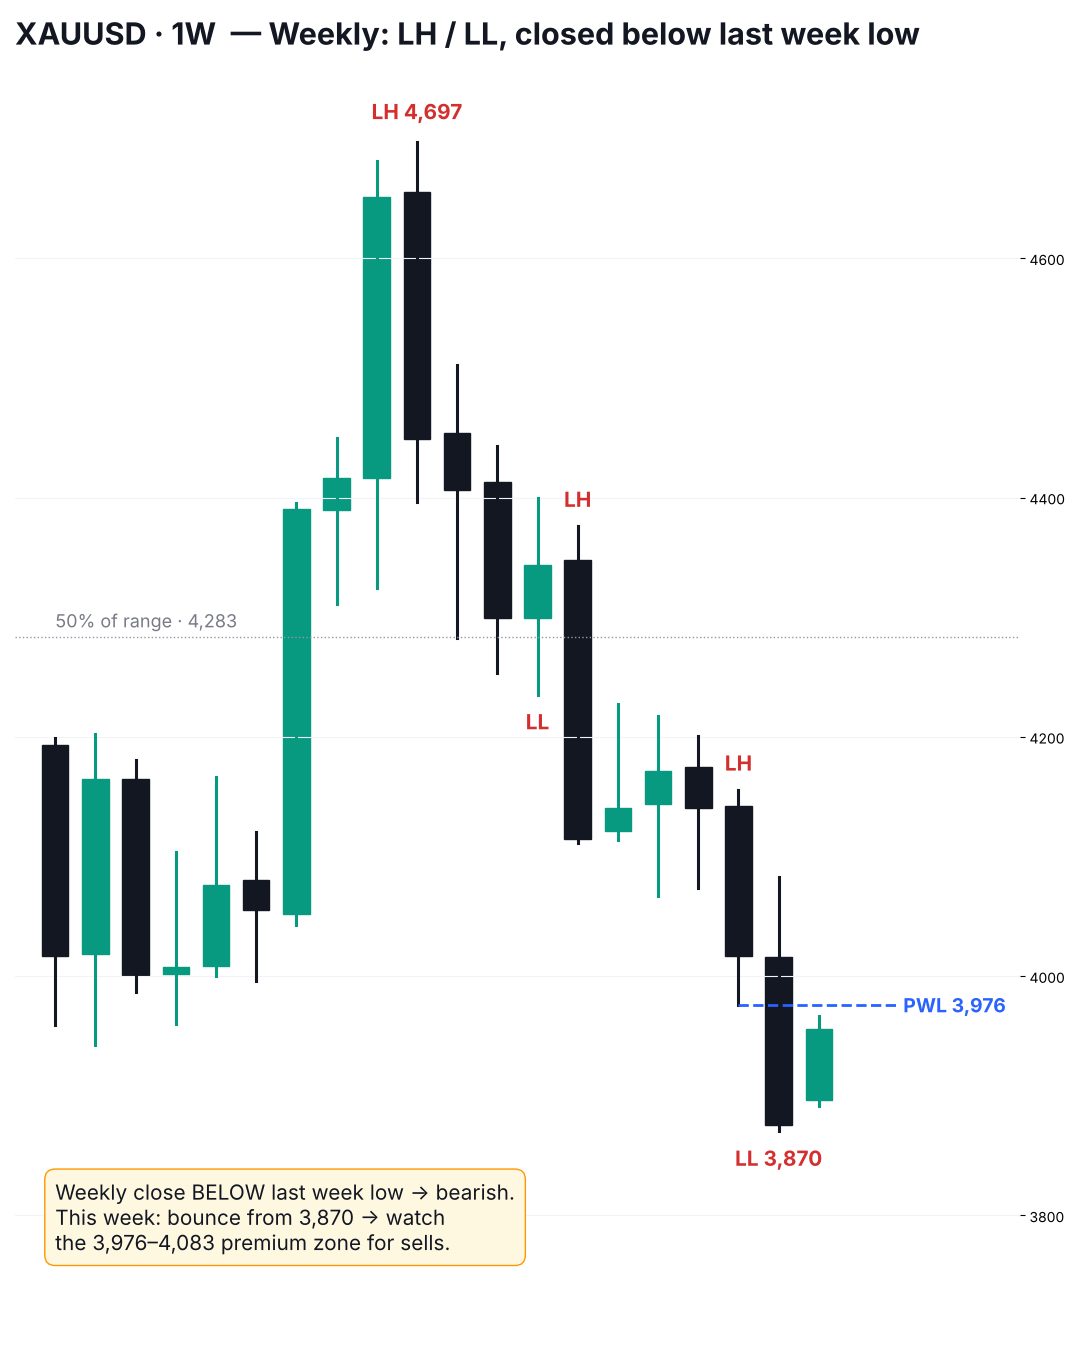
The weekly chart also shows lower highs and lower lows: 4,697, 4,443, 4,400, 4,228, 4,083.
Last week closed at 3,875, below the previous week low of 3,976.
This week price is climbing back from 3,870 (around 3,956 at the time of writing).
What it means: The weekly bias is bearish. The move up so far reads as a pullback, not a change of trend.
Step 3 · Daily
Where could price turn?
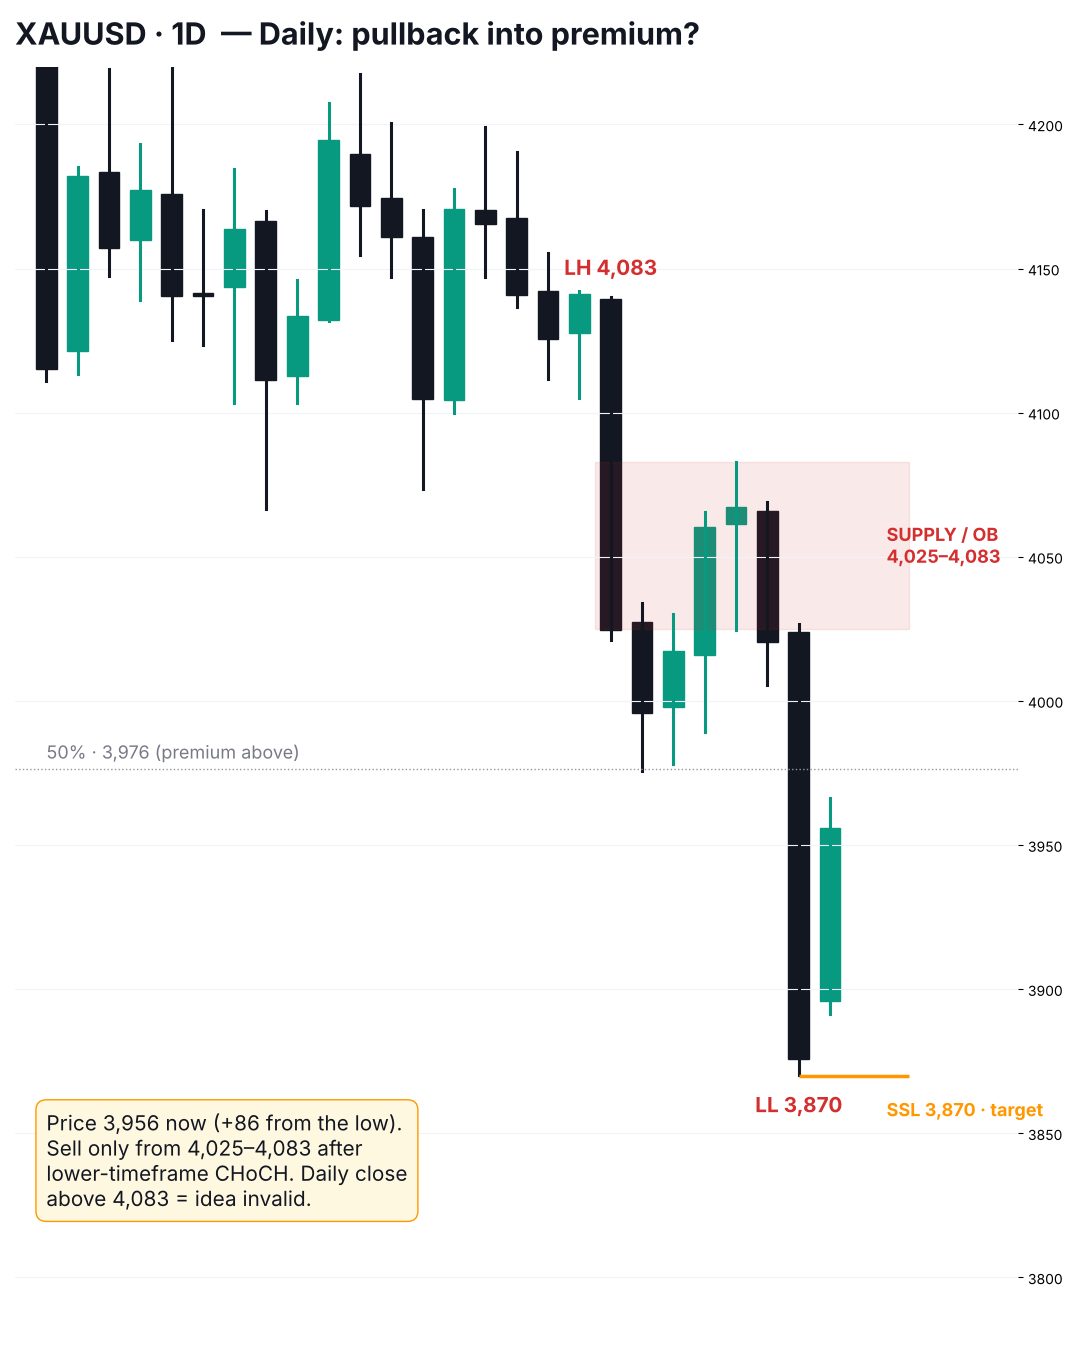
The last daily leg fell from 4,083 to 3,870.
Its 50% level is 3,976. Above it is premium (expensive), where sellers usually look.
The daily supply zone at 4,025–4,083 is where that drop started.
What it means: The area of interest is 4,025–4,083. In the middle of the range, around 3,950, there is nothing to act on.
Step 4 · H4 structure
What did structure confirm?
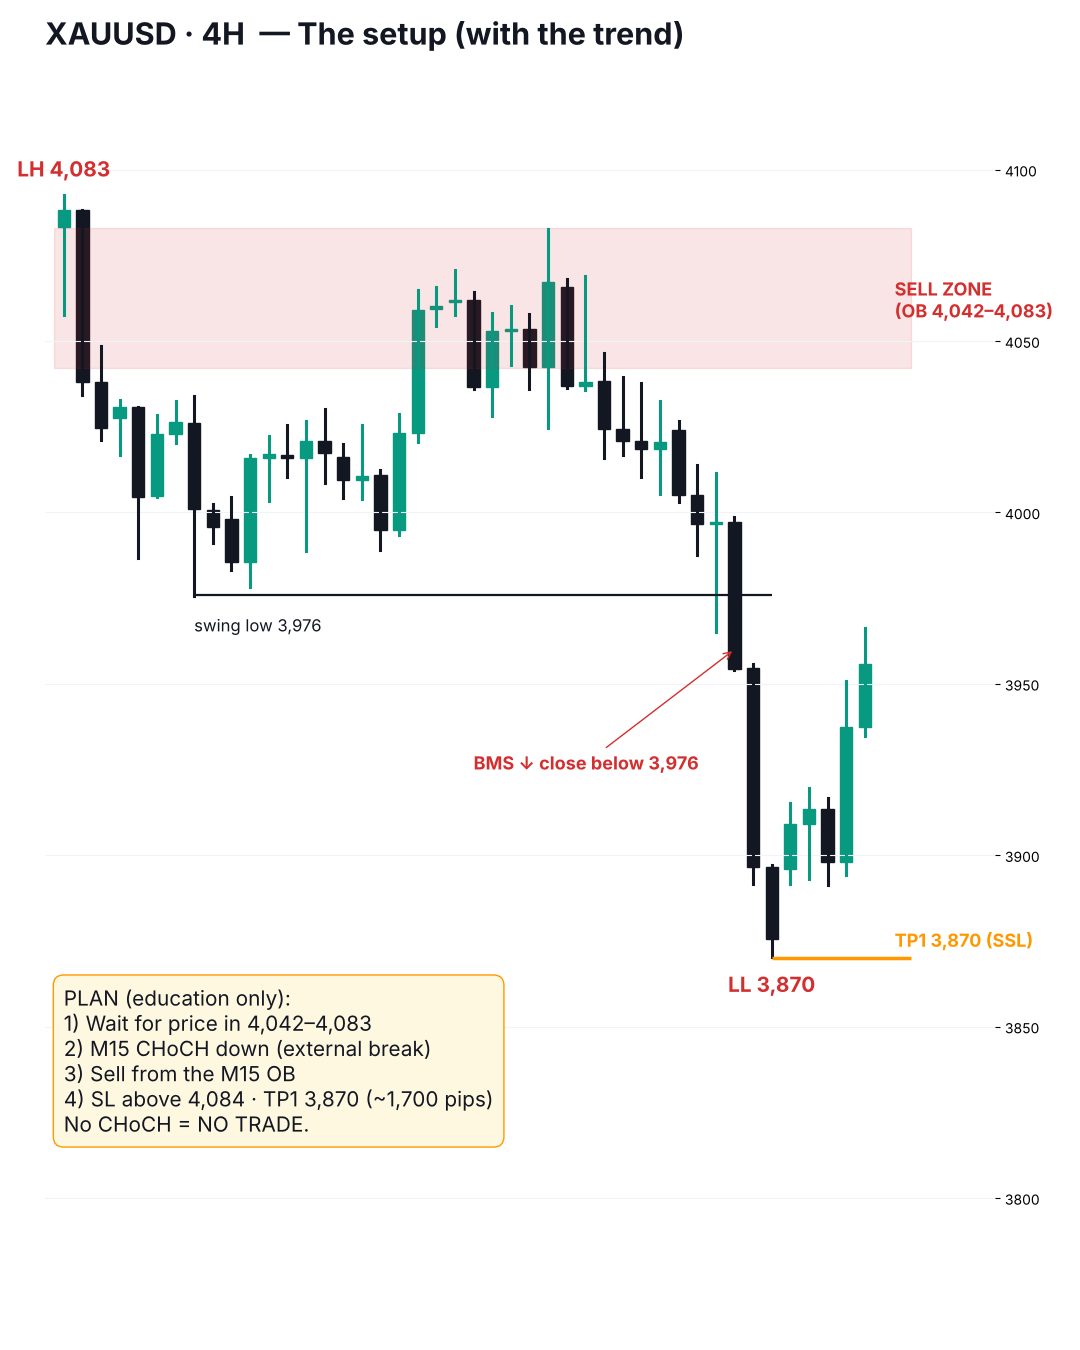
On H4, a candle closed below the 3,976 swing low. That is a break of market structure to the downside.
The start of the leg that made that break leaves a zone at 4,042–4,083.
What it means: H4 agrees with the higher timeframes. The cleanest zone to study for a bearish reaction is 4,042–4,083.
Step 5 · H4 liquidity
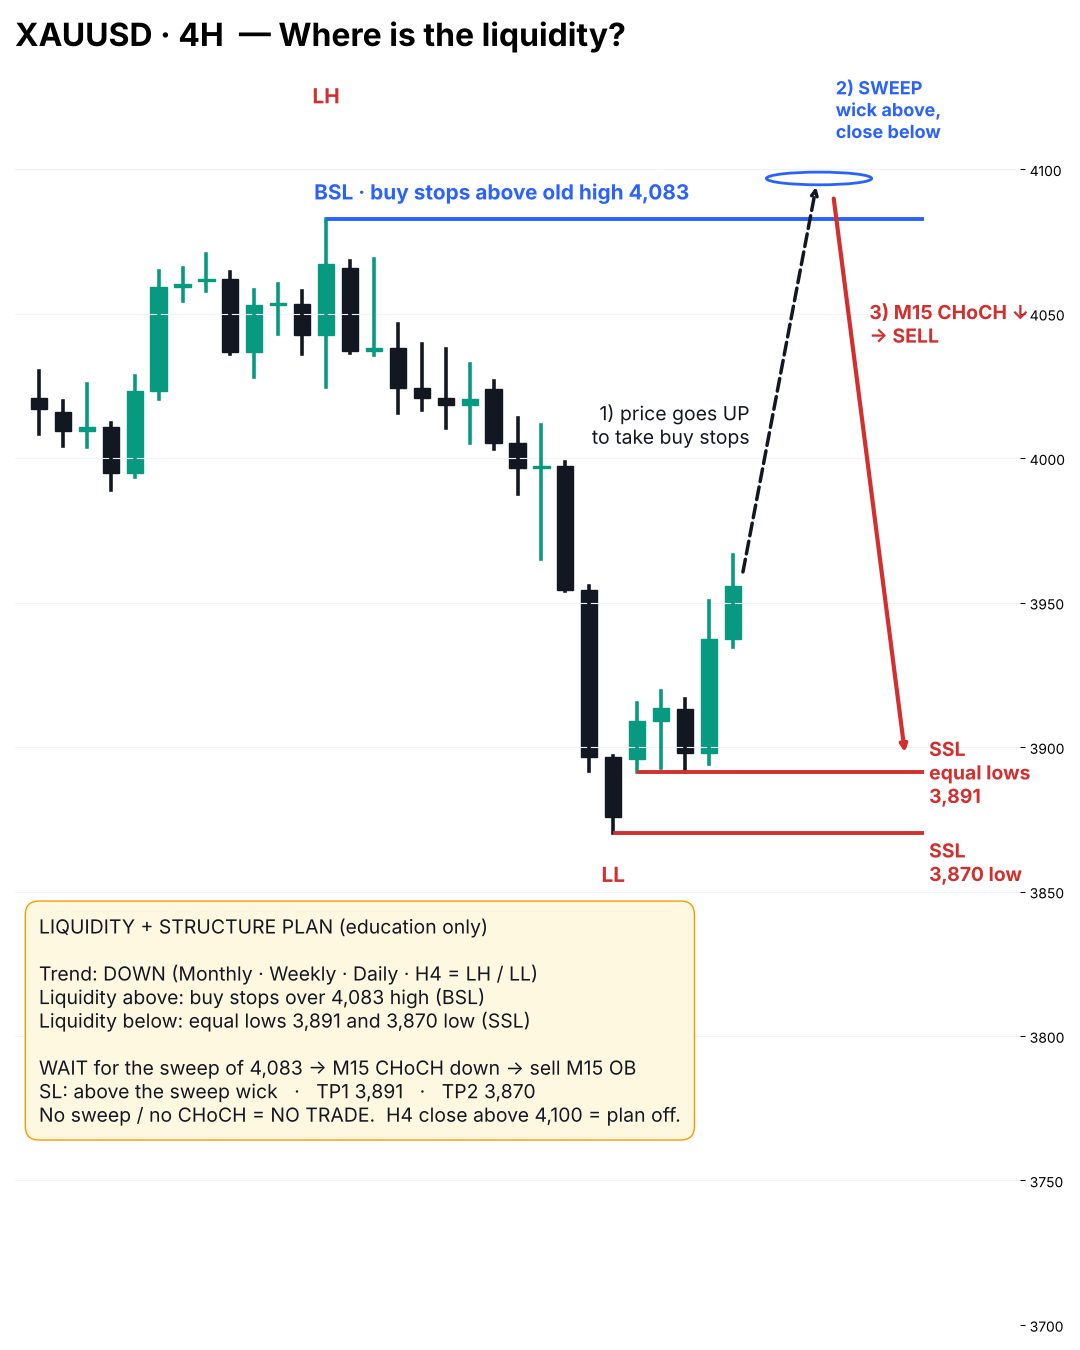
Where is the liquidity?
Buy-side liquidity (BSL) sits above the 4,083 high: the stop losses of short sellers and breakout buy orders.
Sell-side liquidity (SSL) sits at the 3,891 equal lows (price held there three times today) and the 3,870 low.
A sweep means a wick trades above 4,083 but the candle closes back below it.
After a sweep, a candle close below the last M15 higher low would be a change of character (CHoCH), and the M15 order block of that move would be the zone to study.
What it means: The sequence we are watching: buy-side liquidity is taken first (the sweep), then the sell-side liquidity at 3,891 and 3,870 becomes the logical draw on price.
Summary
What we are watching
Higher-timeframe trend
Down on the monthly, weekly, daily and H4 charts (lower highs and lower lows)
1. Wait for
A sweep of the buy stops above 4,083 (wick above, close back below)
2. Confirmation
An M15 change of character to the downside, on a candle close
3. Zone to study
The M15 order block left by that move
Invalidation idea
Above the high of the sweep wick
Liquidity below
3,891 (equal lows), then 3,870 (the last low)
Scenario cancelled
An H4 candle closes above 4,100
No sweep or no CHoCH means no setup. If price drops from the middle of the range without reaching 4,083, we do not chase it; we wait for the next structure.
Educational only, not financial advice. This analysis is for education only. It is not a signal, and past structure does not guarantee future price. Trading gold on margin carries a high risk of loss.
Get new analysis in the free Telegram community.
New posts and market notes from our team, free. Educational only, not financial advice.